
Visensia – The Safety Index
From conception to FDA Clearance and in Practice use; The story of Visensia – The Safety Index
Proof Of Concept
The proof of concept work for Visensia was carried out at the John Radcliffe Hospital (Oxford, UK) from 2004 to 2006.
3,500 hours of continuous vital sign monitoring data was collected from “high-risk” patient groups to create the “Training data set”:
o Patients monitored for at least 24hrs after a myocardial infarct and again 5 days later
o Patients with severe heart failure
o Patients with acute respiratory problems
o Elderly patients with hip fractures (monitored before and after operation)
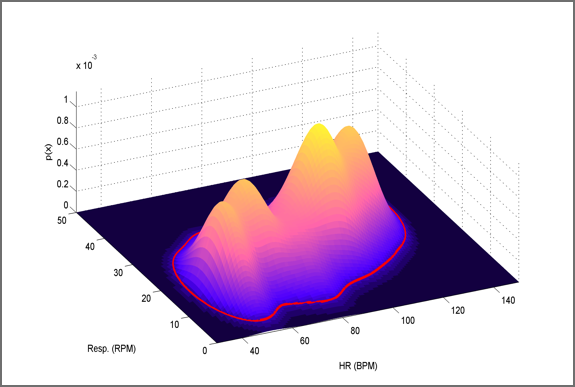
From these data a computer model of normality for the vital signs for these “high risk patients” was developed called Visensia.
− Using the Visensia model of normality, we can determine the probability that any new set of vital signs were “normal” for a high risk patient
− A Visensia Alert is generated when the probability of a patients vital signs are outside of “normal” and the Visensia Safety Index VSI ≤ 3
In 168 monitored patients, 95% of the episodes of severe physiological abnormalities identified by the system were deemed, after review by two senior clinicians, to have been valid alerts (Tarassenko, Hann and Young, 2006).
Visensia - Model Of Normality
Visensia - Positive Prediction Value
Visensia Index – Validation
Validation of Visensia was performed in a 24-bed Step-Down Unit (SDU) at the University of Pittsburgh Medical Centre (UPMC).
A 3 phase study design was implemented. In Phase I a 630 patient study evaluated whether Visensia could accurately predict patient deterioration and events requiring the intervention of the Medical Emergency Team (MET). Nurses and patients were blinded to Visensia. All MET events of respiratory and/or cardiac cause were detected by Visensia in advance, with the mean advanced detection time prior to MET activation being 6.33 hours (Hravnak M, Edwards L, Clontz A, et al. 2008).
In Phase 3 of the UPMC study, the Visensia index was used to alert the nursing staff to the occurrence of vital sign abnormalities. This led to a 58% reduction in the number of times patients became critically unstable, from an average 0.9 times per patient in Phase I to an average of 0.4 times per patient in Phase 3 (Hravnak M, DeVita MA, Clontz A, et al. 2011).
During the 8 weeks of the Phase 3 trial no unexpected deaths occurred in the SDU (with 308 patients in total), compared with 6 unexpected deaths in the same unit during Phase 1 (323 patients in total, Hravnak M, DeVita MA, Clontz A, et al. 2011).
In the subsequent 24 months following completion of the study this trend continued, no patient being monitored by Visensia had an unexpected fatal cardiac event (Pinsky MR, 2008).
- Hours Prior to MET Activation
Visensia – Advanced Warning
Visensia - Reduction In Instability
- Standard Care
- Visensia
Visensia – Life Saving Insight
In Practice
Data gathered over a 4 year period following the installation of Visensia at St. Joseph Mercy (Oakland, US) has demonstrated a 37.5 % decline in code-blue responses in the medical-surgical unit, a 34.5 % reduction in mortality rates, and nearly half a day reduction in length of patient stay. These findings are especially significant because there was a 22 % increase in the severity of illness of patients during that period.
- Over 4 Year Period
% Change In Severity Of Patient Illness
Reduction In Mortality
Decline In Code-Blue Responses
References:
Pinsky, M R. (2008) Predictive Patient Safety Technology: Study. No patient on the Visensia monitor has had an unexpected fatal cardiac event. RegenerativeMedicine.net. [Online] Available at: http://www.regenerativemedicine.net/NewsletterArchives.asp?qEmpID=715&qC (Accessed on 27th July 2010)
Fregoli, F. Chief Informatics Officer, St Joseph Mercy Oakland. 37.5% Decline in code-blue responses, 34.5% reduction in mortality rates and nearly half a day reduction in length of patient stay. First reported in: Crain’s Detroit Business. St Joseph Mercy’s new Pontiac tower puts hospitality into the hospital [Online] Available at:
http://www.crainsdetroit.com/article/20140727/NEWS/307279966/st-joseph-mercys-newpontiac-tower-puts-hospitality-into-the (Accessed on 28th July 2014)
Downloads
Story Of Clinical Trials

Visensia – Story Of Clinical Trials
Publications
Brochure
Any Questions?
If you want to find out more – contact us here